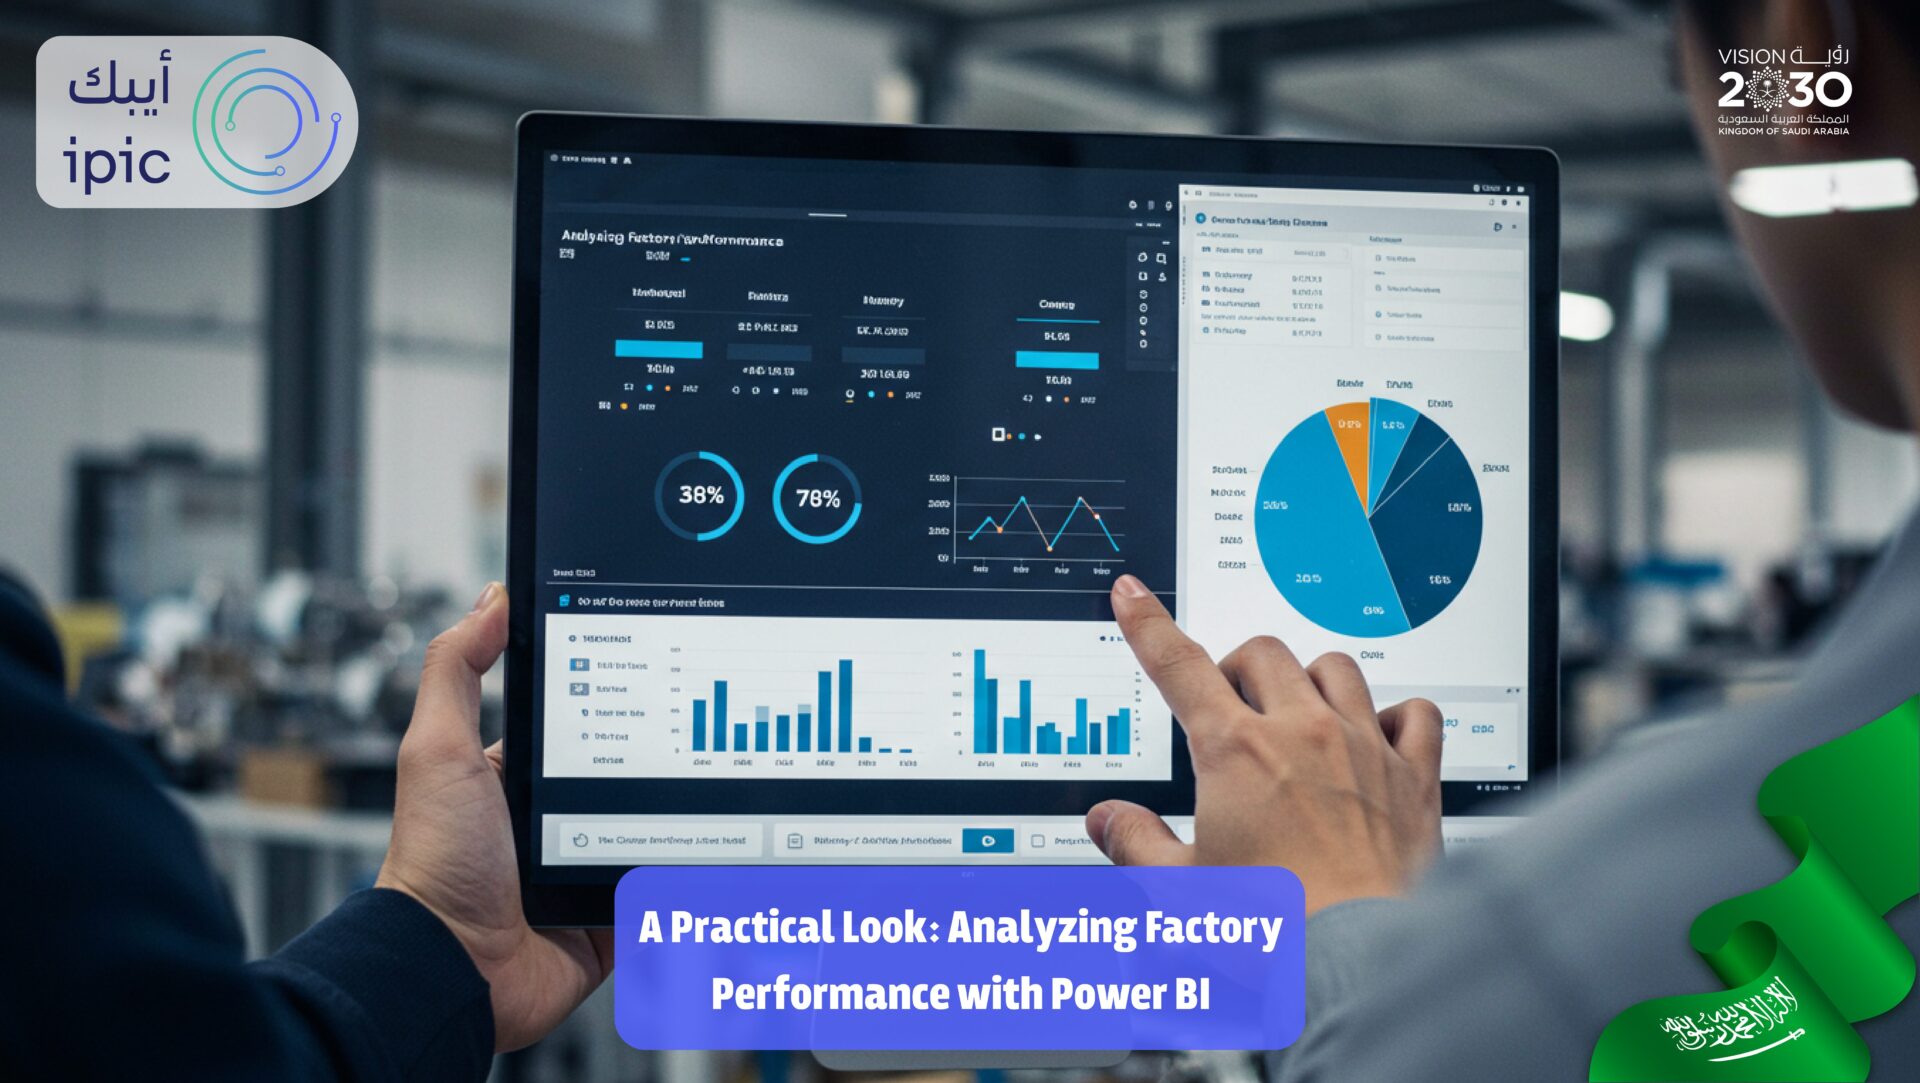
A Practical Look: Analyzing Factory Performance with Power BI
Analyzing Factory Performance with Power BI : Transform manufacturing data into insights that drive growth and performance
Introduction
In the era of smart manufacturing, data is more than just numbers—it’s a strategic asset. Factories today rely on accurate, timely analytics to improve performance, reduce waste, and enable faster decision-making.
Among the most effective tools in this field is Power BI, a powerful platform that helps turn complex manufacturing data into actionable intelligence.
Why Power BI for Manufacturing?
Modern factories generate data from numerous sources: MES, ERP, IoT sensors, and production equipment. The challenge isn’t capturing this data—but understanding it.
Power BI offers a dynamic and flexible solution to integrate multiple data sources and build intuitive dashboards that give operators, engineers, and managers a real-time view of performance on the shop floor.
Practical Use Cases of Power BI in Manufacturing
1. Tracking Actual vs. Planned Production
Visualize daily, weekly, or monthly output against planned targets. Analyze production gaps and understand where discrepancies are occurring.
2. Downtime Analysis
Identify frequent sources of downtime—whether mechanical, electrical, or human—and analyze trends to guide maintenance priorities or training needs.
3. Monitoring Product Quality
Track defect rates and correlate them with machine settings, shift schedules, or material batches. This enables teams to take proactive steps toward improving quality.
4. Evaluating Line Efficiency (OEE)
Analyze availability, performance, and quality to calculate and optimize Overall Equipment Effectiveness (OEE) across lines or facilities.
5. Material and Energy Consumption Analysis
Integrate production, inventory, and energy data to evaluate efficiency, cost per unit, and support sustainability initiatives.
How IPIC Enables Power BI for Factories
IPIC bridges the gap between data science and real-world industrial environments. Our team builds Power BI solutions designed for the specific challenges of Saudi manufacturers:
- Developing robust data models linked to MES, ERP, and IoT systems
- Designing dashboards tailored for production, maintenance, and quality management
- Training teams to interpret insights and integrate them into operations
- Embedding data analytics into daily workflows for smarter, faster decisions
Conclusion: Data Makes the Difference
Analyzing factory performance is no longer optional—it’s essential. With Power BI, manufacturers can move from reactive decisions to proactive strategies driven by real-time data.
The difference between a traditional and a smart factory starts with how you see your data—and how you use it.
Is your factory simply seeing numbers, or understanding the story they tell?
Let IPIC help you unlock the full potential of your data.


